6 Months of Testing Revealed the Truth About SEO Visuals
Key Takeaways:
Milana Kostova published a six-month controlled test on Search Engine Land on May 15, analyzing visual content impact across 47 articles
Not all visual assets improve SEO performance. Some types of images and embedded media had no measurable effect on rankings or engagement
Original images and custom visuals outperformed stock photos. AI systems increasingly parse images using OCR and visual context
Articles with relevant, well-optimized visuals saw stronger engagement signals. Articles with decorative visuals did not
The test provides specific, actionable data in an industry where most visual SEO advice is based on opinion rather than controlled experiments
Everyone in content marketing has heard the advice: add images to your blog posts. It helps SEO. It improves engagement. More visuals means better performance.
But is that actually true? And if so, which visuals matter?
Milana Kostova published a six-month test on Search Engine Land on May 15, 2026, that tested these assumptions with real data across 47 articles. The findings challenge several common beliefs about how visual content affects search performance.
Not all images improve rankings
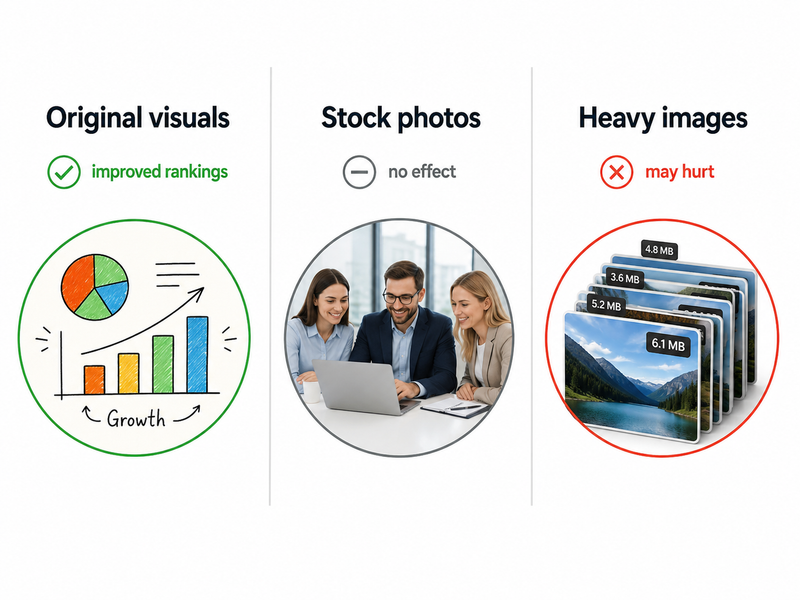
The most important finding is that adding images to content does not automatically improve SEO performance. The type, relevance, and quality of the visual matters far more than its presence.
Articles with relevant, original visuals saw measurable improvements in engagement metrics: longer time on page, lower bounce rates, and better scroll depth. These engagement signals correlated with improved rankings over the six-month period.
Articles with generic stock photos or decorative images that did not add information to the content saw no meaningful improvement. In some cases, heavy images that slowed page load times may have hurt performance more than they helped.
The distinction is between visuals that inform and visuals that decorate. A chart showing data from the article adds value. A stock photo of someone typing on a laptop does not.
Original visuals outperform stock content
Custom visuals, including original charts, screenshots, annotated images, and infographics built from the article's own data, consistently outperformed stock photography.
This finding aligns with broader trends in how AI systems process images. Google and other AI platforms now use computer vision to parse images directly. They read text within images through OCR, analyze visual context, and use that information alongside traditional alt text and captions to understand what an image communicates.
An original chart showing a data trend gives AI systems specific, extractable information. A stock photo gives them nothing beyond what the alt text says. As multimodal AI becomes more sophisticated, the gap between original and stock visuals will likely widen.
Search Engine Land published a separate analysis in December 2025 on image SEO for multimodal AI, noting that "images are now parsed like language" and that "OCR, visual context, and pixel-level quality shape how AI systems interpret and surface content."
Infographics work when they add unique data
Infographics have been a content marketing staple for over a decade. The test found they still work, but only when they contain unique data or analysis that the reader cannot get from the text alone.
An infographic that visualizes original research findings or survey data adds citation-worthy visual content. An infographic that restates the article's bullet points in a visual format does not contribute meaningfully to engagement or rankings.
The practical takeaway: create infographics when you have original data to visualize. Skip them when the visual is just a reformatted version of text that already exists on the page.
Video embeds and interactive elements showed mixed results
Embedded videos improved engagement on articles where the video directly supported the content topic. A product walkthrough embedded in a review article kept readers on the page longer.
But videos that were loosely related or added for the sake of having multimedia did not move metrics. The same pattern holds: relevance determines value.
Interactive elements like calculators, expandable sections, and comparison tools showed the strongest engagement signals in the test.
Search Engine Land's Alex Galinos noted on May 12 that "the biggest SEO gains increasingly come from interactive experiences that remove friction and answer intent immediately."
What content teams should change based on this data
Stop adding stock photos to every article by default. If the image does not add information, context, or visual proof of a claim, it is not helping.
Invest in original visuals for cornerstone content. Charts, annotated screenshots, process diagrams, and data visualizations are worth the effort. They improve engagement, support AI citation, and differentiate your content from competitors using the same stock libraries.
Optimize images technically. Compress files, use descriptive alt text, write captions that add context, and ensure images do not slow page load times. A relevant image that adds 3 seconds of load time may do more harm than good.
Consider interactive content for high-value pages. Calculators, comparison tools, and expandable FAQs create engagement that static visuals cannot match. These formats also align with how AI systems extract structured, actionable information.
This test is rare. Most visual SEO advice is anecdotal. Having six months of controlled data across 47 articles gives content teams something they can actually use to make investment decisions about visual production.
Disclaimer:This article is AI-assisted content and may contain errors. The primary test data is from Milana Kostova's analysis published on Search Engine Land on May 15, 2026. Individual results vary by industry, content type, and domain authority.